MIST
Magnetosphere, Ionosphere and Solar-Terrestrial
Nuggets of MIST science, summarising recent papers from the UK MIST community in a bitesize format.
If you would like to submit a nugget, please fill in the following form: https://forms.gle/Pn3mL73kHLn4VEZ66 and we will arrange a slot for you in the schedule. Nuggets should be 100–300 words long and include a figure/animation. Please get in touch!
If you have any issues with the form, please contact This email address is being protected from spambots. You need JavaScript enabled to view it..
Detection of the northern infrared aurora at Uranus using the W.M. Keck II Telescope and NIRSPEC instrument
By Emma Thomas (University of Leicester)
Three decades of searching for the infrared aurorae finally come to a successful conclusion as portions of the northern (IAU southern) aurorae have been confirmed at Uranus. The icy planet represents an enigma within our solar system, with the first and only visit by Voyager II in 1986, it remains one of the least documented planets in our solar system. This is exceptionally apparent with the planet’s history of auroral observations, where the UV aurorae have been observed a handful of times but no infrared (IR) counterpart has been confirmed, despite both aurorae appearing at Jupiter and Saturn. Analysis of IR aurorae at both Jupiter and Saturn have challenged what we know about magnetosphere-ionosphere coupling, highlighting a need for IR analysis at Uranus to uncover its mysteries. Since 2020 our team has meticulously analysed archived data of Uranus during 2006 from the Keck II telescope on Mauna Kea in Hawai’i. The timing of these observations was key, close to equinox, as it provided an optimal view of the predicted locations of the northern and southern aurorae. By examining the emission lines from these aurorae (the emitting ion being H3+) between 3.94 to 4.01 μm, we carried out a full spectrum best fit across 5 fundamental lines for each spatial pixel across the planet’s disk. By comparing these lines at specific locations, we were able to identify an average 88% increase in column ion densities with no significant temperature changes localised close to or at expected auroral locations for the northern aurora. With this confirmation at Uranus, we look forward to a new age of auroral investigations at both ice giant planets.
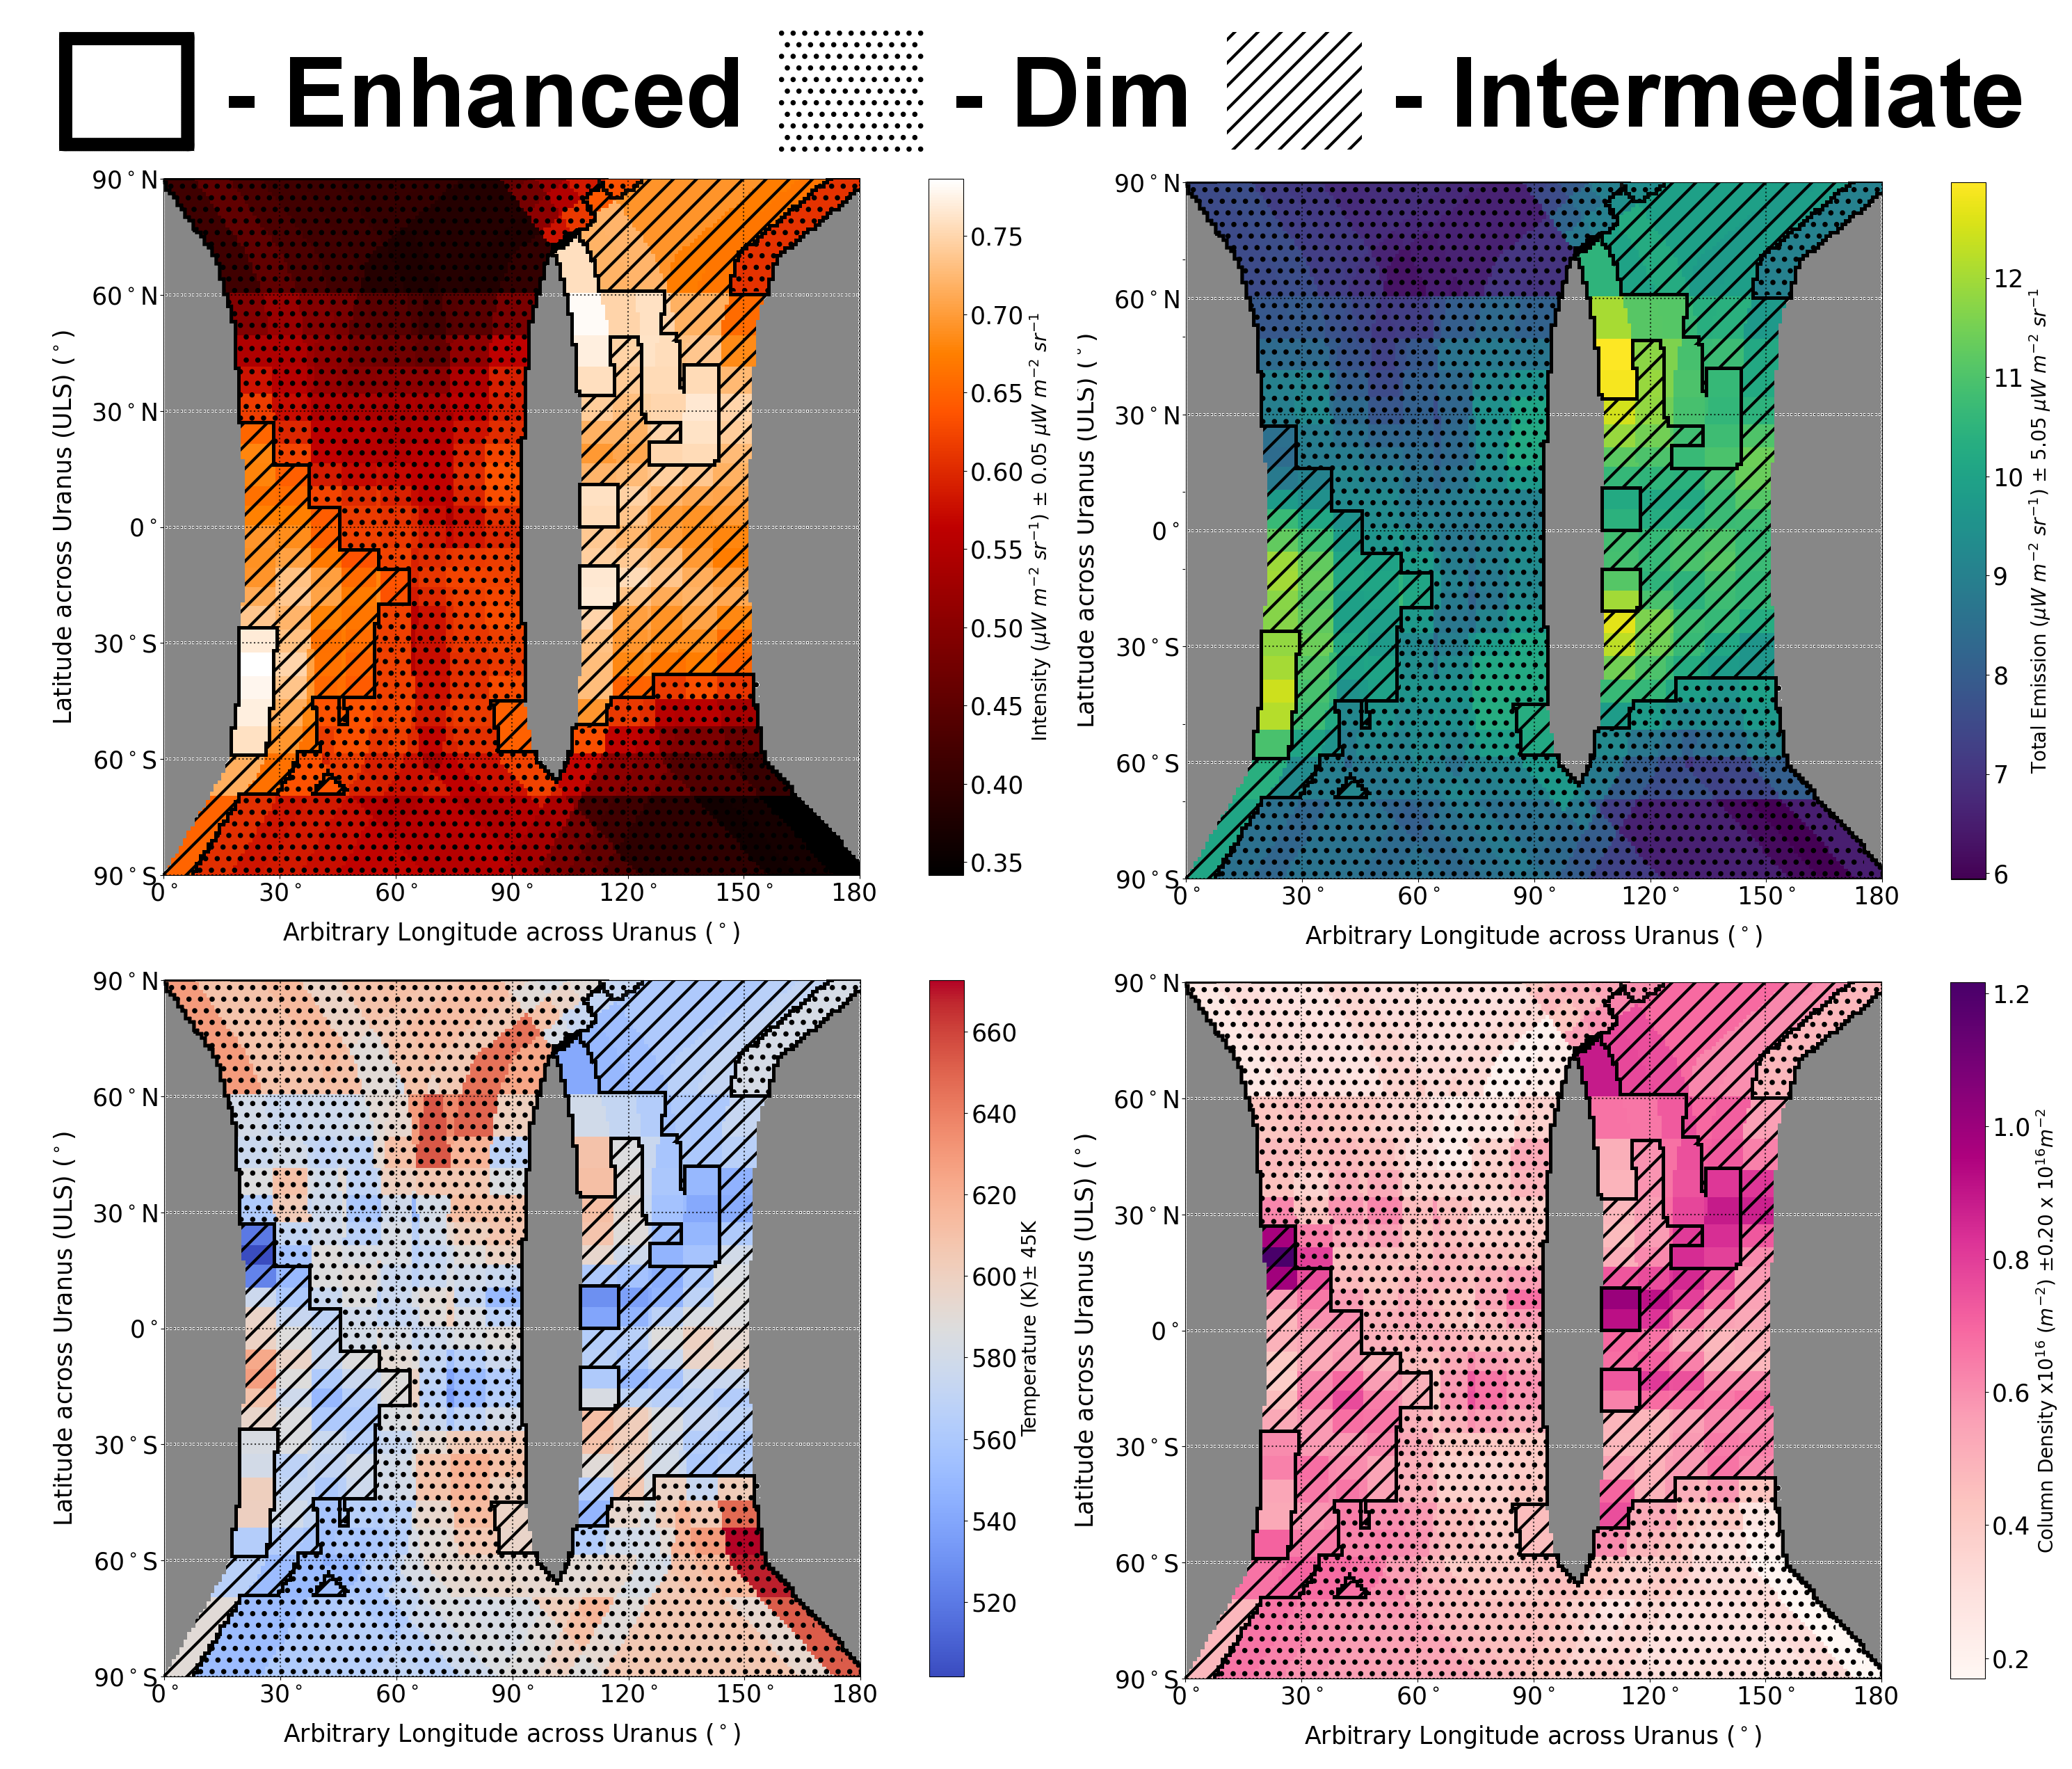
References:
Thomas, E.M., Melin, H., Stallard, T.S. et al. Detection of the infrared aurora at Uranus with Keck-NIRSPEC. Nat Astron (2023). https://doi.org/10.1038/s41550-023-02096-5
A Model of High Latitude Ionospheric Convection derived from SuperDARN radar EOF Data
By Mai Mai Lam (British Antarctic Survey)
Variations in space weather in the ionized region of the Earth’s atmosphere (the ionosphere) can result in expansion of the atmosphere, increasing the atmospheric drag on objects, such as satellites, in the thermosphere. We aim to significantly improve the forecasting of the effects of atmospheric drag on satellites by more accurate modelling of space weather effects on the motion of ionized particles (plasma) in the ionosphere. We have developed a model of the variation in plasma motion using a small number of solar wind variables. The model was built using a solar cycle’s worth (1997 to 2008 inclusive) of 5-minute resolution Empirical Orthogonal Function (EOF) patterns derived from Super Dual Auroral Radar Network (SuperDARN) line-of-sight observations of the plasma motion in the high-latitude northern hemisphere ionosphere (Shore et al., 2021). The model is driven by four variables: (1) the interplanetary magnetic field component By, (2) the solar wind coupling parameter epsilon, (3) a trigonometric function of the day-of-year, and (4) the monthly solar radio flux at 10.7 cm (the F10.7 index). Our model is good at reproducing the original data set - if 0 indicates that there is no reproduction and 1 indicates exact reproduction, then our model scores 0.7. Data set reproduction is best around the maximum in the solar cycle and worst at solar minimum. This is mainly due to differences in the spatiotemporal data coverage between these times but possibly also due to the model’s specification of the physical processes coupling the Sun to the Earth’s ionosphere. Our model could easily be used to forecast the ionospheric electric field about 1 hour in advance, using the real-time solar wind data available from spacecraft located upstream of the Earth.

References:
Lam, M. M., Shore, R. M., Chisham, G., Freeman, M. P., Grocott, A., Walach, M.-T., & Orr, L. (2023). A model of high latitude ionospheric convection derived from SuperDARN EOF model data. Space Weather, 21, e2023SW003428. https://doi.org/10.1029/2023SW003428
Shore, R. M., Freeman, M., Chisham, G., Lam, M. M., & Breen, P. (2022). Dominant spatial and temporal patterns of horizontal ionospheric plasma velocity variation covering the northern polar region, from 1997.0 to 2009.0 - VERSION 2.0 (Version 2.0) [Dataset]. NERC EDS UK Polar Data Centre. https://doi.org/10.5285/2b9f0e9f-34ec-4467-9e02-abc771070cd9
Solar Energetic Particle Events Detected in the Housekeeping Data of the European Space Agency's Spacecraft Flotilla in the Solar System
By Beatriz (University of Leicester)
Space Weather is the discipline that aims at understanding and predicting the state of the Sun, interplanetary medium and its impact on planetary environments. One source of Space Weather is Solar Energetic Particles (SEPs), which are emitted by the Sun and enhance the radiation and particles that flow in space. Predicting the motion of these particles is important but difficult as we need good satellite coverage of the entire inner Solar System, and only a limited number of spacecraft have the necessary instrumentation. Thanks to the European Space Agency flotilla in the solar system, that is, Venus Express, Mars Express, ExoMars-Trace Gas Orbiter, Rosetta, BepiColombo, Solar Orbiter, and Gaia, we performed a feasibility study of the detection of SEP events using engineering sensors in the main body of the spacecraft that were originally placed there to monitor its health during the mission. We explored how much scientific information we can get from these engineering sensors, such as the timing and duration of an SEP impacting the spacecraft, or the minimum energy of those particles to trigger a detection. The results of this study have the potential of providing a good network of solar particle detections at locations where no scientific observations are available.
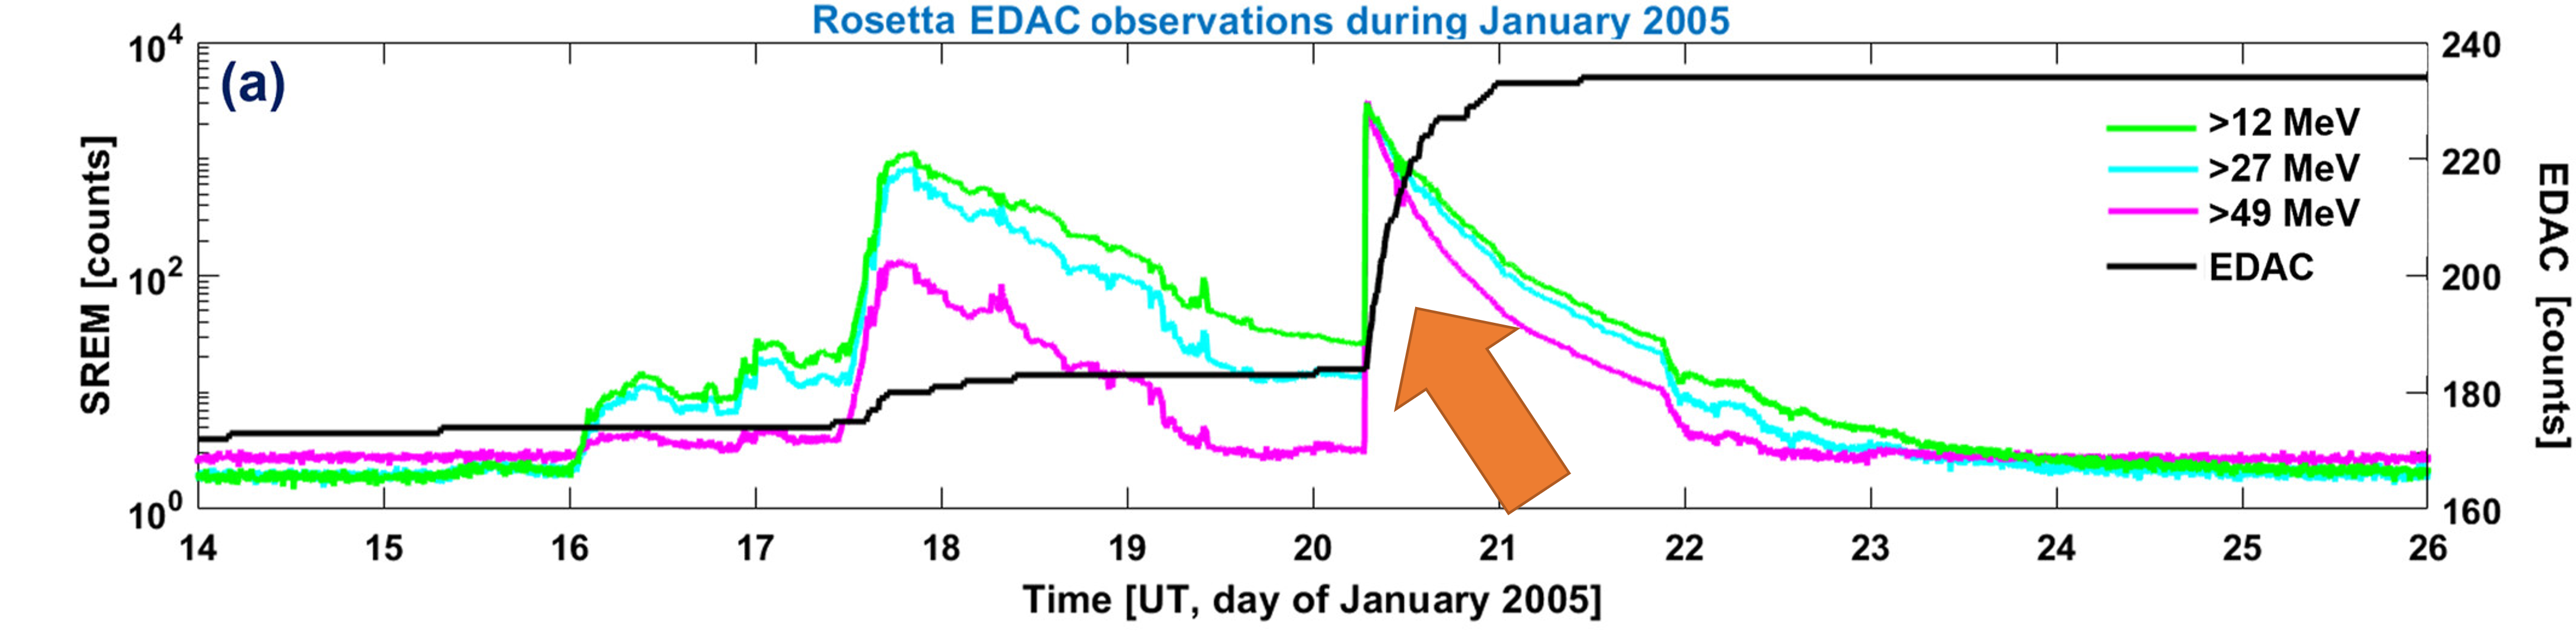
Please see publication for further details: , , , , , , et al. (2023). Solar energetic particle events detected in the housekeeping data of the European Space Agency's spacecraft flotilla in the Solar System. Space Weather, 21, e2023SW003540. https://doi.org/10.1029/2023SW003540
Newcomb-Benford Law as a generic flag for changes in the derivation of long-term solar terrestrial physics timeseries
By Sandra Chapman (University of Warwick), A. M. Bendito Nunes (undergraduate student, University of Warwick), and J. Gamper (undergraduate student, University of Warwick)
Space weather can have significant impact over a wide range of technological systems including power grids, aviation, satellites and communications. In common with studies across the geophysical sciences, space weather modelling and prediction requires long term space and ground-based parameters and indices that necessarily aggregate multiple observations, the details of which can change with time. The Newcomb-Benford law (NBL) specifies the relative occurrence rates of the leading digit in a sequence of numbers arising from multiple operations under certain conditions, the first non-zero digit in a number is more likely to be 1 than 2, 2 than 3, and so on. In this first application to space weather parameters and indices, we show that the NBL can detect changes in the instrumentation and calibration underlying long-term geophysical records, solely from the processed data records. In space weather, as in other fields such as climate change, it is critical to be able to verify that any observed secular change is not a result of changes in how the data record is constructed. As composite indices are becoming more widespread across the geosciences, the NBL may provide a generic data flag indicating changes in the constituent raw data, calibration or sampling method.
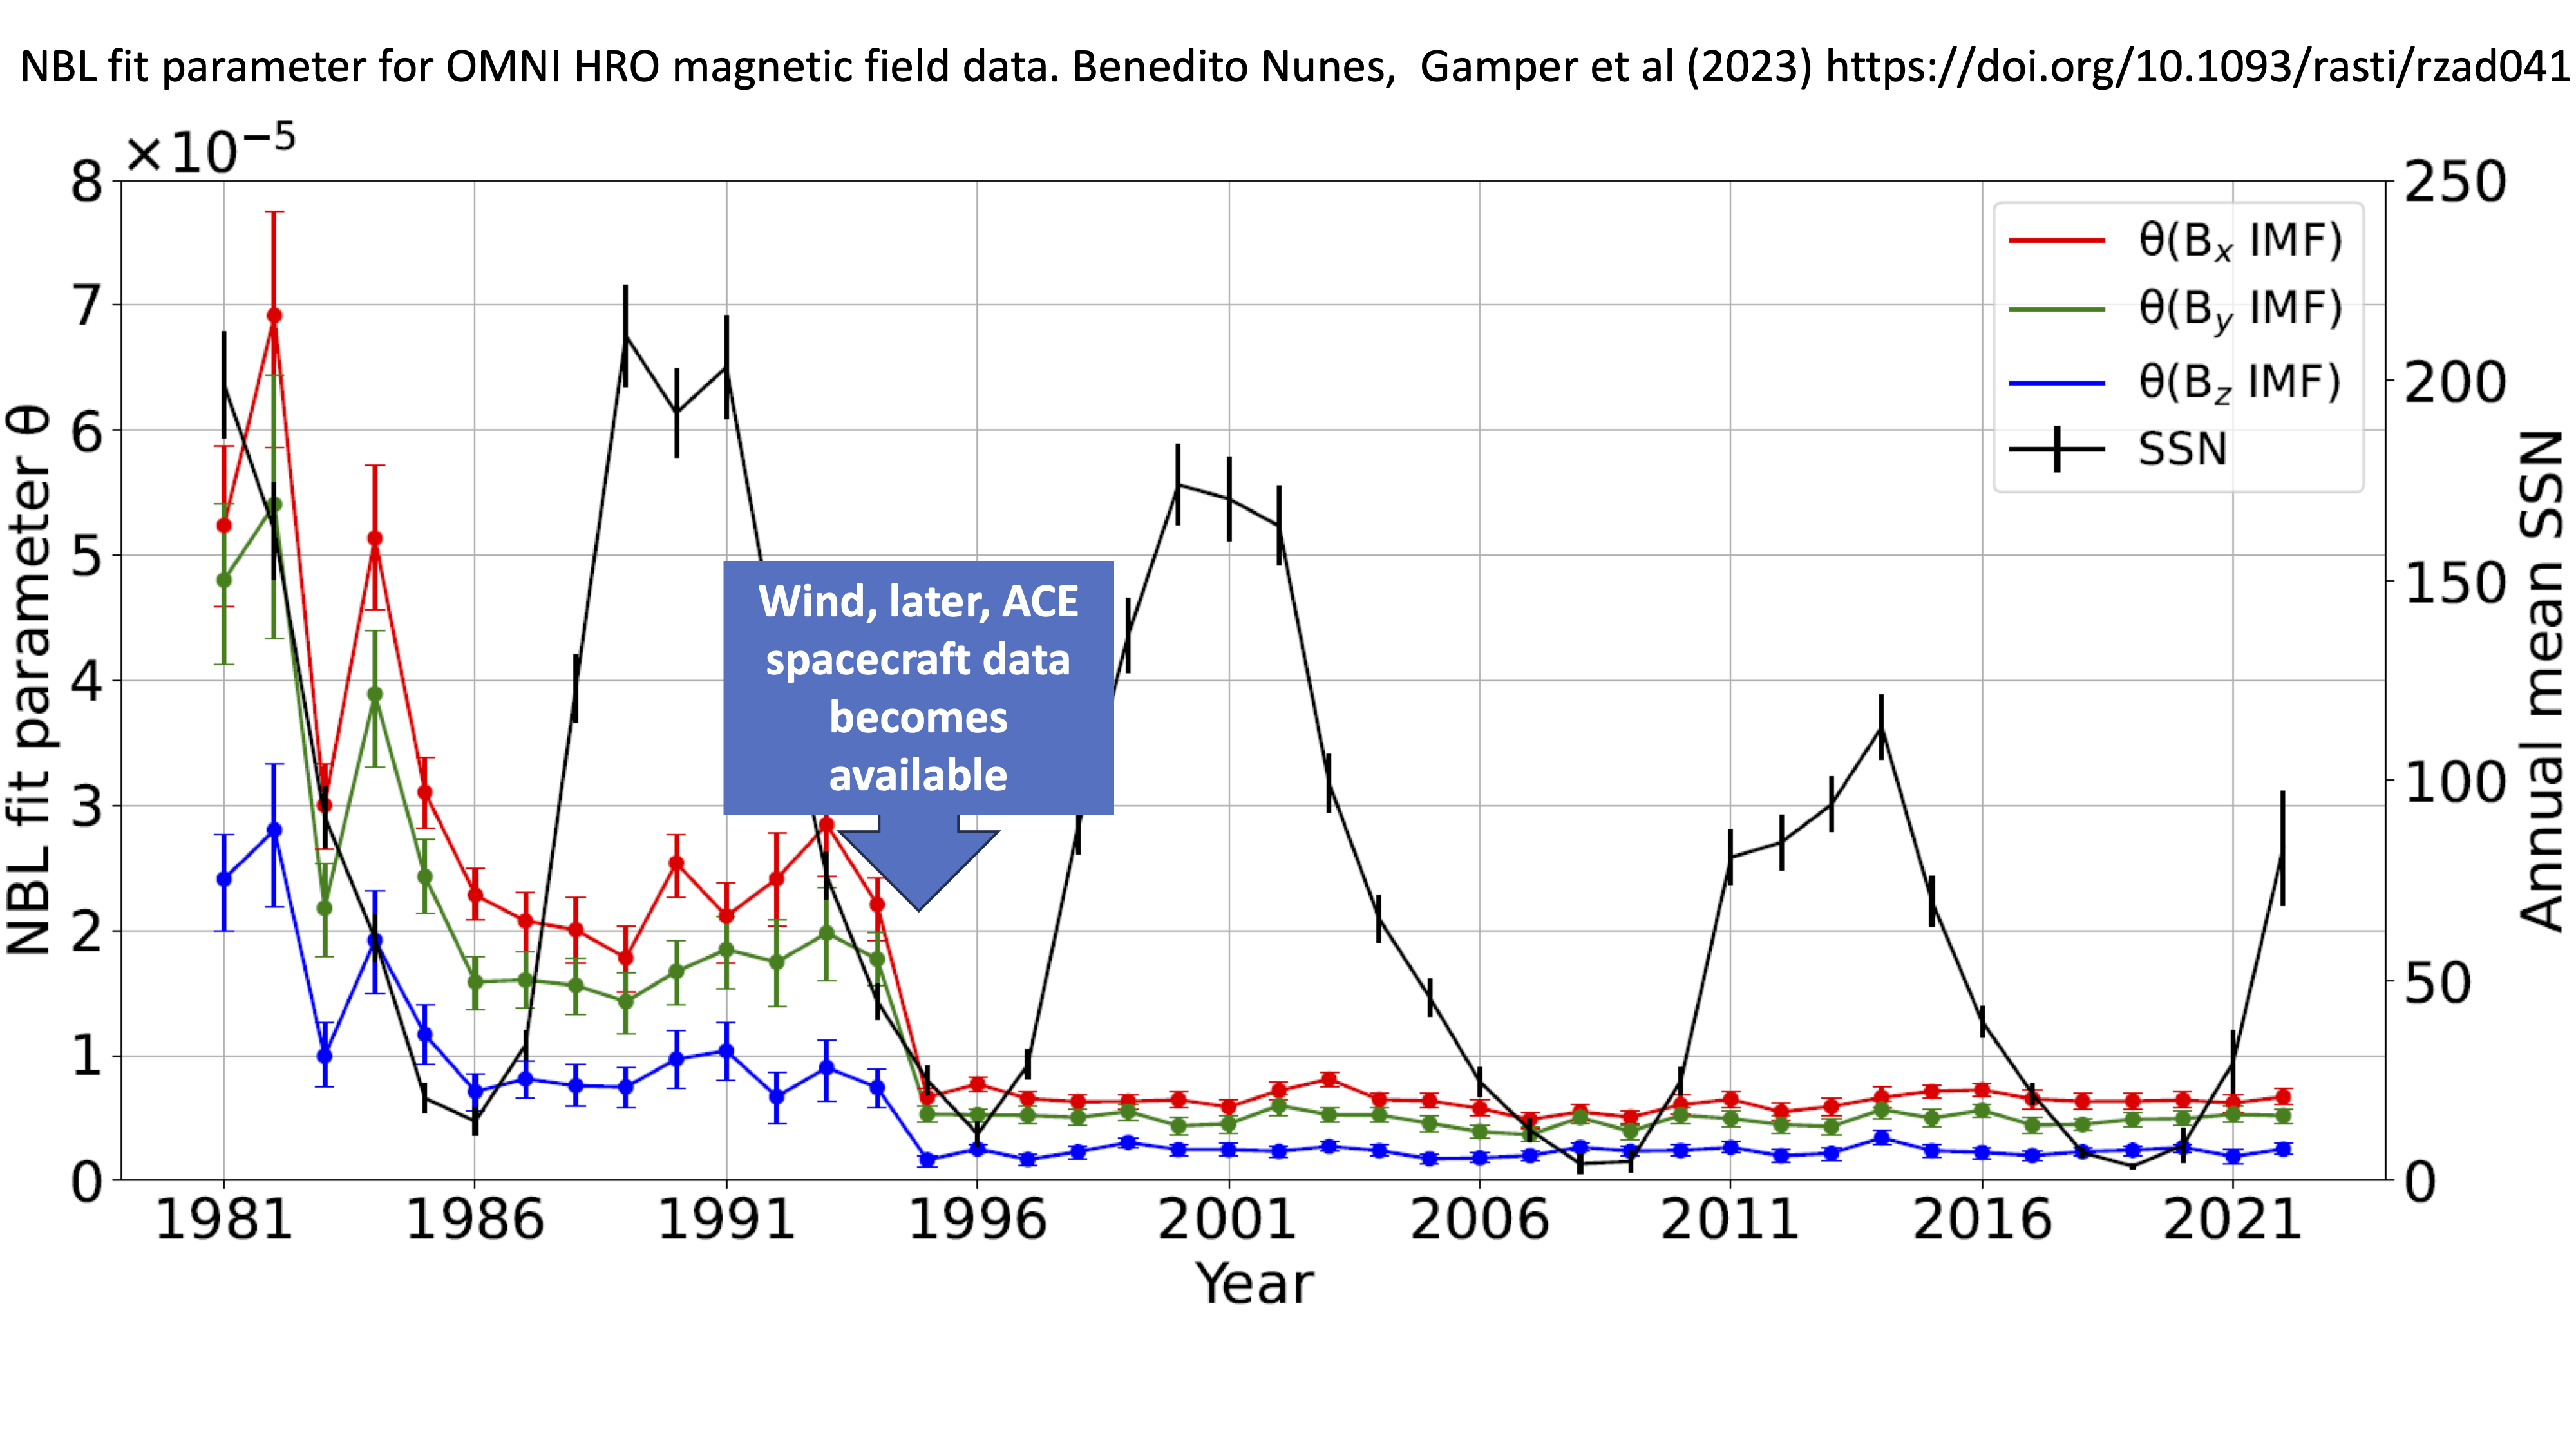
Figure 1: The plot shows the NBL goodness of fit parameter for magnetic field observed since 1981 by a series of satellites upstream of the earth. The NBL fit parameter shows a clear decrease when more sophisticated satellites, Wind. and later ACE, became available.
The joint 1st authors of this paper contributed to this research during their final year undergraduate Physics project at Warwick University
See paper for full details:
A. M. Benedito Nunes, J. Gamper, S. C. Chapman, M. Friel, J. Gjerloev, Newcomb-Benford Law as a generic flag for changes in the derivation of long-term solar terrestrial physics timeseries, RAS Techniques and Instruments (2023) https://doi.org/10.1093/rasti/rzad041
Predicting Swarm Equatorial Plasma Bubbles via Machine Learning and Shapley Values
By Sachin Reddy (UCL Mullard Space Science Laboratory)
In the nightside ionosphere, plumes of low-density plasma known as Equatorial Plasma Bubbles (EPBs) are prone to form. EPBs can disrupt GNSS signals which depend on quiet ionospheric conditions, but the day-to-day variability of bubbles has made predicting them a considerable challenge. In this study we present AI Prediction of EPBs (APE), a machine learning model that accurately predicts the Ionospheric Bubble Index (IBI) on Swarm. IBI identifies EPBs by correlating (R2) a simultaneous change in the current density and magnetic field.
APE is XGBoost regressor that is trained on data from 2014-2022. It performs well across all metrics, exhibiting a skill, association, and root mean squared error score of 0.96/1, 0.98/1 and 0.08/0 respectively. APE performs best post-sunset, in the American/Atlantic sector, around the equinoxes, and when solar activity is high. This is promising because EPBs are most likely to occur during these periods.
Shapley Value analysis reveals that F10.7 is the most important feature, whilst latitude is the least. Bespoke indices may be required to fully capture the effects of geomagnetic activity which is known to both enhance and suppress EPB formation. The Shapley analysis also reveals that low solar activity, active geomagnetic conditions, and the Earth-Sun perihelion all contribute to an increased EPB likelihood. To the best of our knowledge, this is the first time this exact combination of features has been linked to bubble detection. This showcases the ability of Shapley values to enable new insights into EPB climatology and predictability.
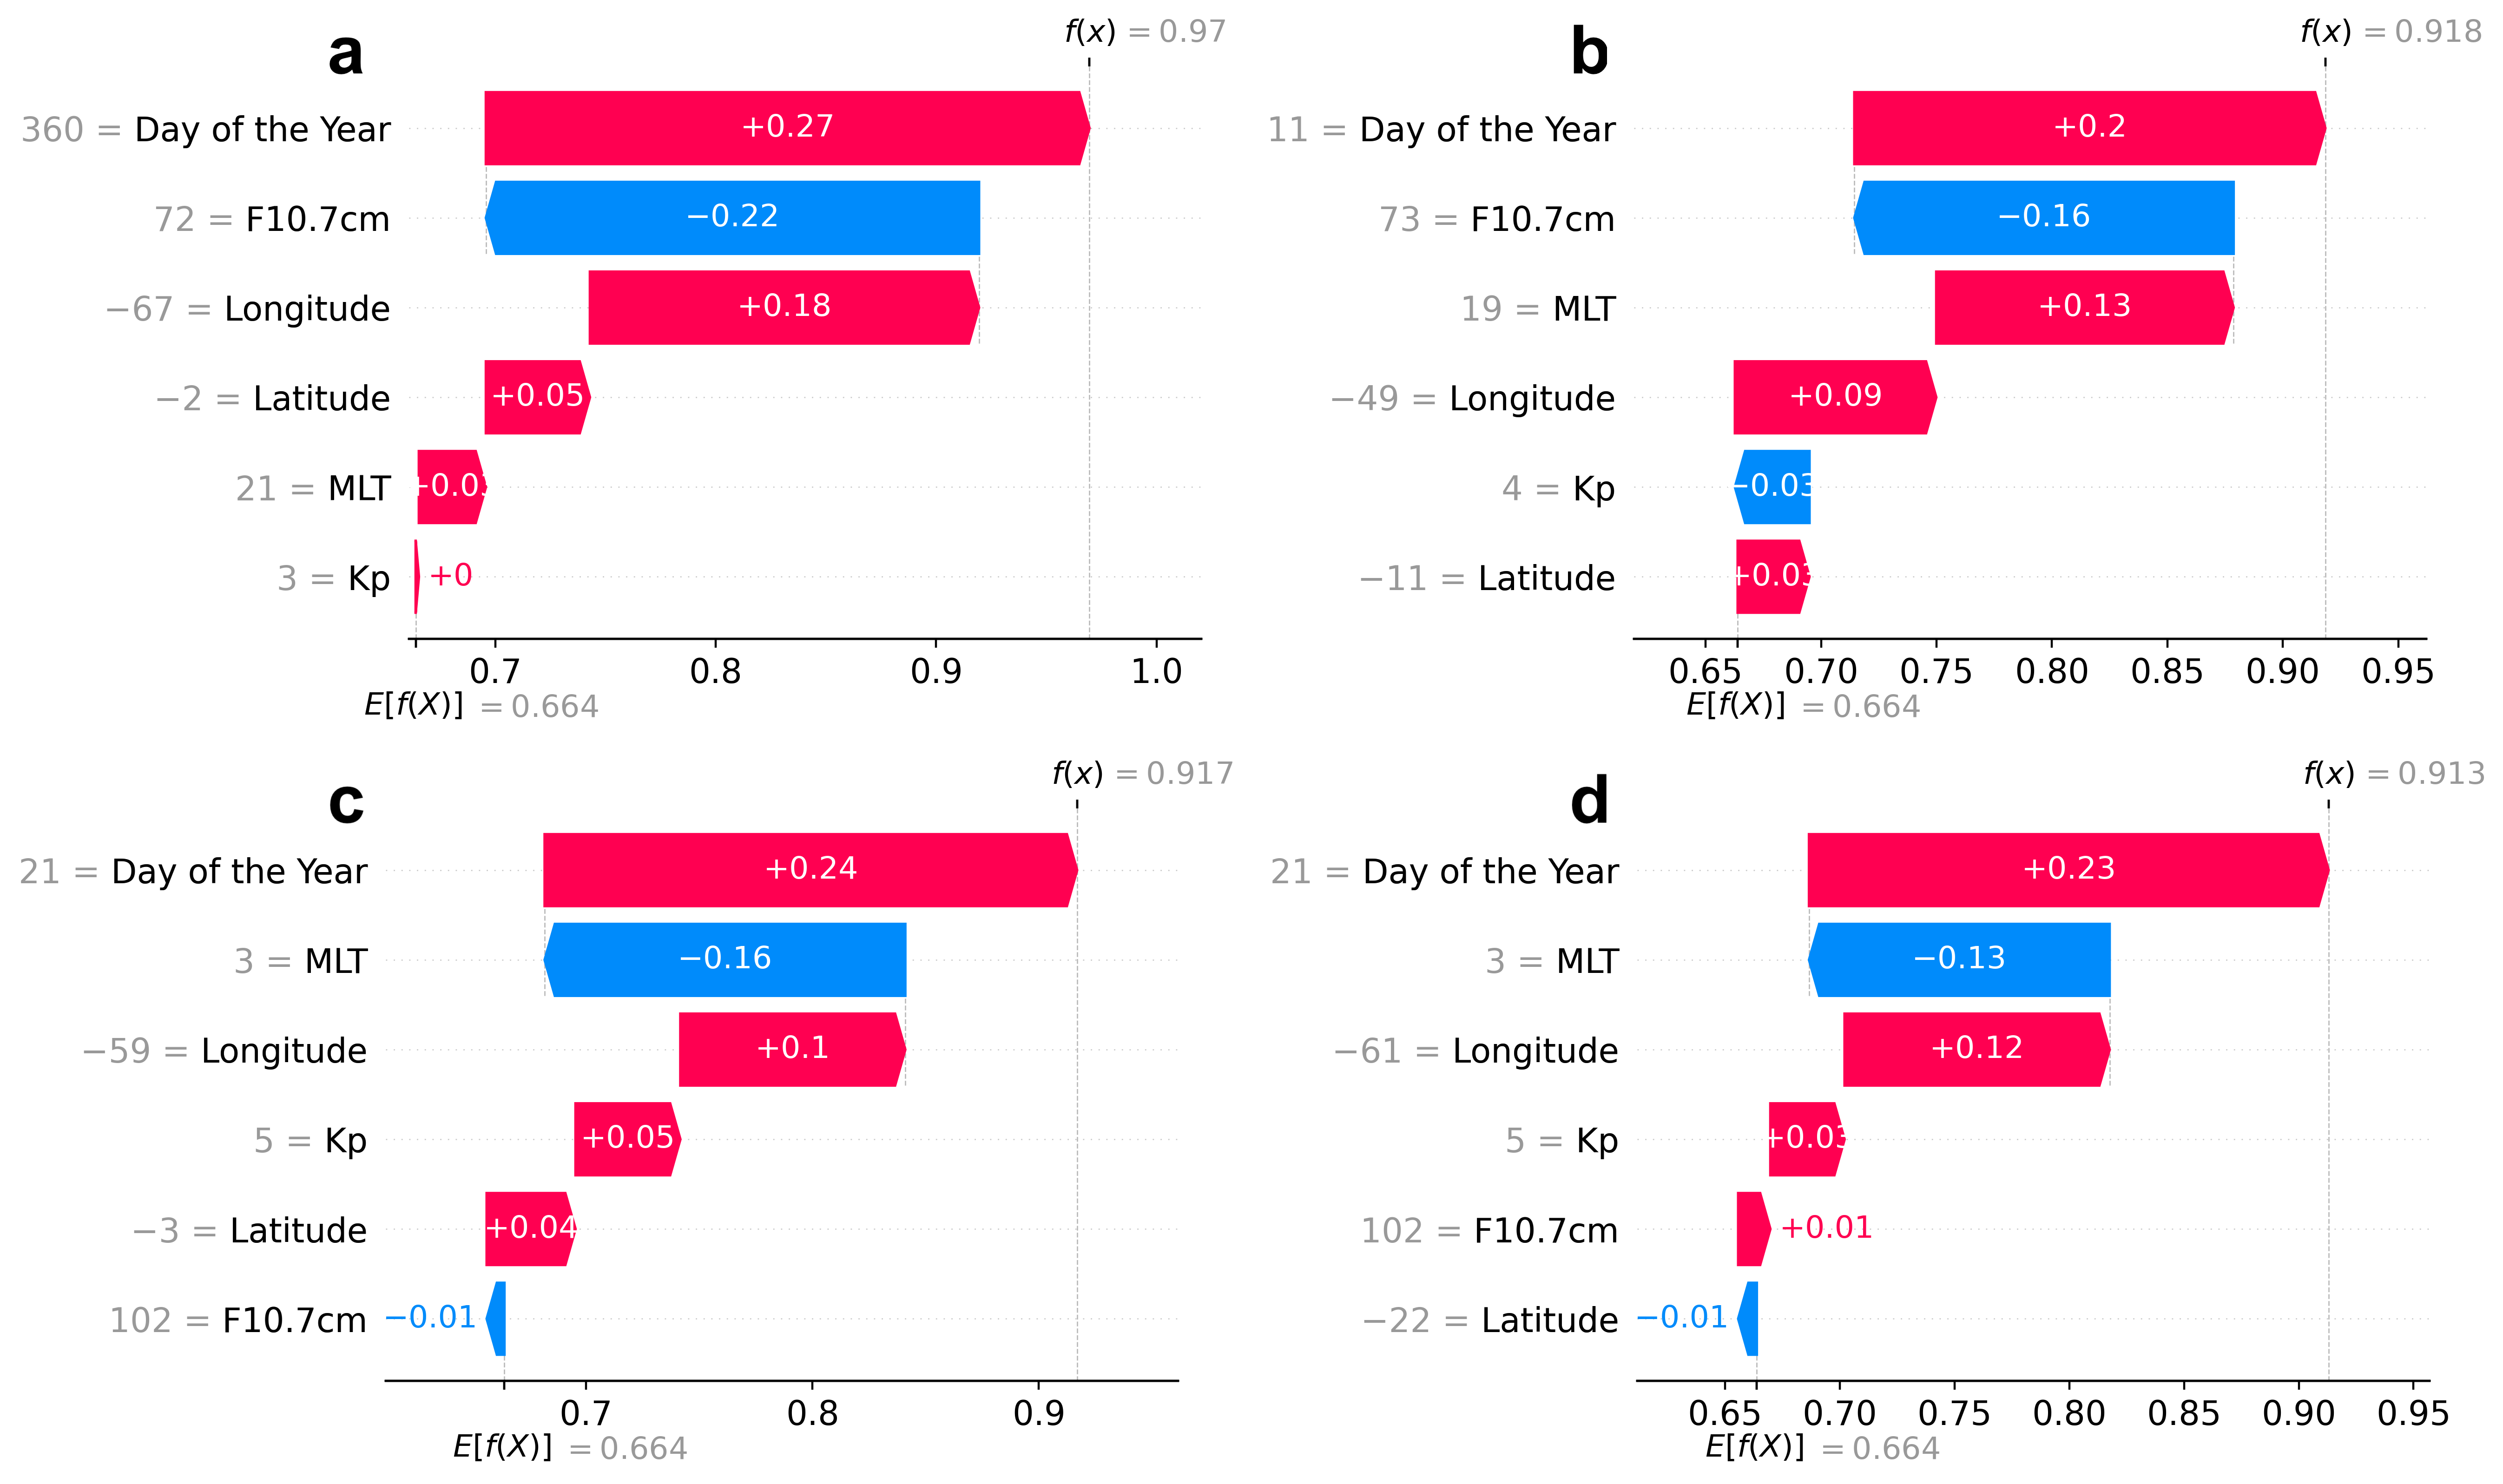
See full paper for details: , , , , , , et al. (2023). Predicting swarm equatorial plasma bubbles via machine learning and Shapley values. Journal of Geophysical Research: Space Physics, 128, e2022JA031183. https://doi.org/10.1029/2022JA031183